FROM MY RECLINER, NJ – It’s always been a popular belief that the best NFL teams build through the draft. But last week Steve Palazzolo brought it to a new level. He sent out two tweets to really hammer home how important draft picks are.
Group 1
Group 2
So, according to those tweets, the correlation between wins and the draft is purely based on the number of picks. Not which rounds they’re in, and not who’s drafting them. So do we buy it?
First, is there anything about the teams in group 2 that stand out? Basically, is there another reason why these teams didn’t succeed last season?
On the surface it doesn’t seem so. Almost all have been to the playoffs in the last few years, the majority have a stable quarterback situation, and only two of the teams — Detroit and Tampa Bay — had bad coaches.
Wait, what about injuries?
According to Football Outsiders the New York Giants were the most injured team in football last season, and San Diego, Atlanta, New Orleans and Tampa Bay all find themselves in the top 10. But so do Green Bay, New England and San Francisco, and two AFC playoff teams in Denver and Indianapolis.
But can the difference really just be the number of players selected? Shouldn’t it matter what round the picks are in? Why don’t we break the numbers down and see what the actual difference was in amount of picks between these two groups:
So it looks like group 1 had more picks in every round except the third, and even that difference wasn’t significant. But overall, the biggest difference is in the later rounds. Group 1 has 2.1 more picks in rounds 1-3 and 8.8 more picks in rounds 4-7. Ok, so it isn’t the case of a few teams having an inordinate amount of top picks.
So, what is it?
I got it! There are good players available in the later rounds, just not a lot of them. By having more picks these teams have a better chance of finding that diamond in the rough. So why don’t we see how successful the two groups have been at finding players in each round:
Well that didn’t go quite to plan. Group 1 only had a better success rate in two rounds, one of which they had less picks! How could they do worse with more chances?
There’s actually a very obvious explanation for this. Even if they found more players in these drafts, the percent should be lower. Think back to elementary school, if the denominator (amount of total picks) grows, you’d need a corresponding growth — or better — in the numerator (total number of active players) to end with a higher percent. So instead let’s just look at the total number of players the two groups yielded in these drafts:
Group 1 Total Players (Avg.): 16.9
Group 2 Total Players (Avg.): 14.4
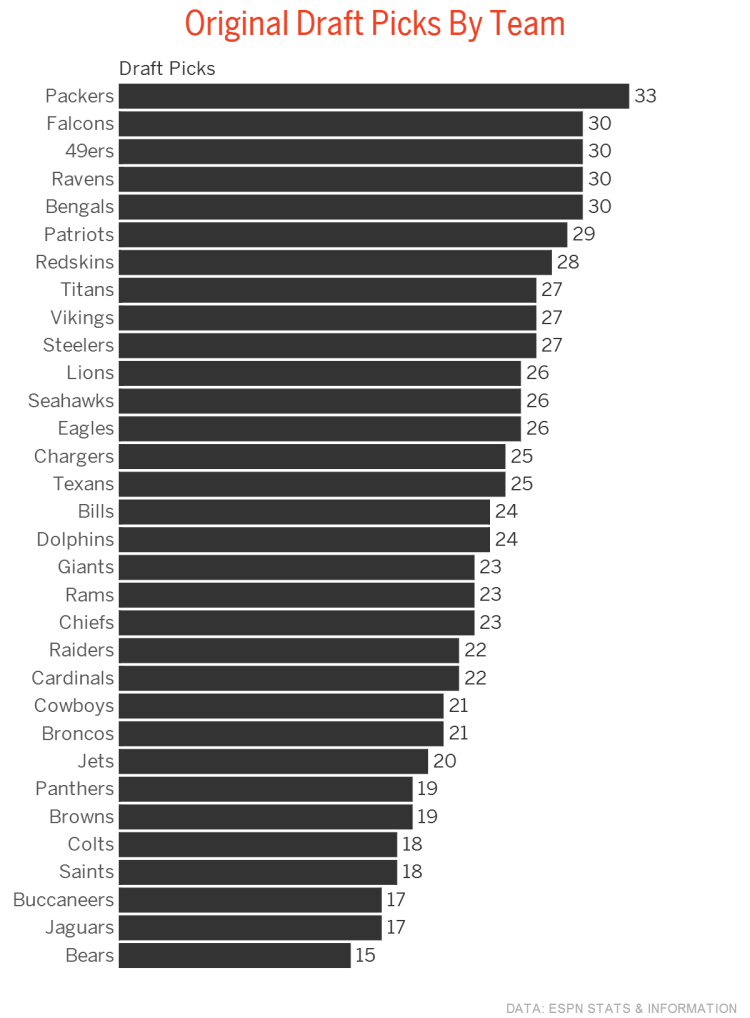
Now that’s more like it. While the percent was lower, group 1 walked away with almost three more players on average in these drafts. Now that might not seem like a ton, but check out this table provided by Kevin Seifert at ESPN charting drafted players still on their original team:
The biggest gap is between the Packers and Bears with 18. But those two teams are extreme outliers; the only two in the NFL separated from the next closest team by more than one player. Removing them, the largest gap is 13 (Jaguars – 17 to Falcons – 30), and that’s over the course of a decade at least.
The numbers we’ve been discussing are just from the last four drafts. More importantly, “total players” only charts whether a player is on a team, not whether they’ve actually had an impact. So instead let’s look at the difference between starters from the two groups.
Group 1 Starters (Avg.): 8.88
Group 2 Starters (Avg.): 7.5
Again, 1+ starter might not seem like a ton, but that’s out of just 22 players, and it’s quite possible the 8.88 starters from group 1 are better than the 7.5 from group 2.
Think about it, there’s a reason group 2 teams couldn’t win ten games last season. Doesn’t the quality of the starters have to be the top reason? And with less total players drafted, there is less competition for those starting spots. So it’s likely the starters from group 2 had less competition and less quality competition.
How can we measure that? Instead of starters, let’s look at the number of impact players these teams have drafted since 2010 (we’ll define impact player as a Pro Bowl player, or an above average quarterback).
Group 1 Impact Players (Avg.): 3.13
Group 2 Impact Players (Avg.): 1.7
Now that’s a pretty big jump. That’s close to two more players on average, and while that doesn’t seem huge, once again, think about how few impact players there are in the league. How many players from each team make the Pro Bowl each season, or an All-American team?
On top of that, all of these players are still on their rookie deals. In a league run by a salary cap, that point can’t be overstated. That’s especially true for the five playoff teams in group 1. All five of them got their quarterbacks after the first round (granted the Patriots got theirs years ago). That means they were free to use their first-round picks on other areas of need, and also means they’re paying bargain basement prices for the most important position on the team.
If there is anything we know about the draft, it’s that it’s a crapshoot. Even the best GMs fail to yield top results, and even the most talented prospects don’t pan out. So what’s the best strategy? Increase your odds by picking more often, even in the later rounds.
To illustrate that just a bit further indulge me in just one more table:
The difference in impact players from group 1 to group 2 was as large in rounds 1-3 (4) as it was in rounds 4-7 (4).
With the draft just a little more than a week away, don’t forget how valuable each selection can be. In fact, it might be smarter for your favorite team to trade down and accumulate more picks, than trade up for that one stud. A fact especially true this year during a draft that everyone loves to describe as deep.


